Anthropic filed its S-1 on October 26, 2026. We read the 421 pages the way we read any corporate narrative: the claim first, then the number that has to be true for the claim to hold. The twenty charts below are the result, grouped by the dimensions we test a narrative against: growth, operating leverage, profitability, reinvestment, products, customers, market, risk and governance. Every figure comes from the filing itself, and every chart carries one finding. Scroll through them in order, or jump to the one you came for.
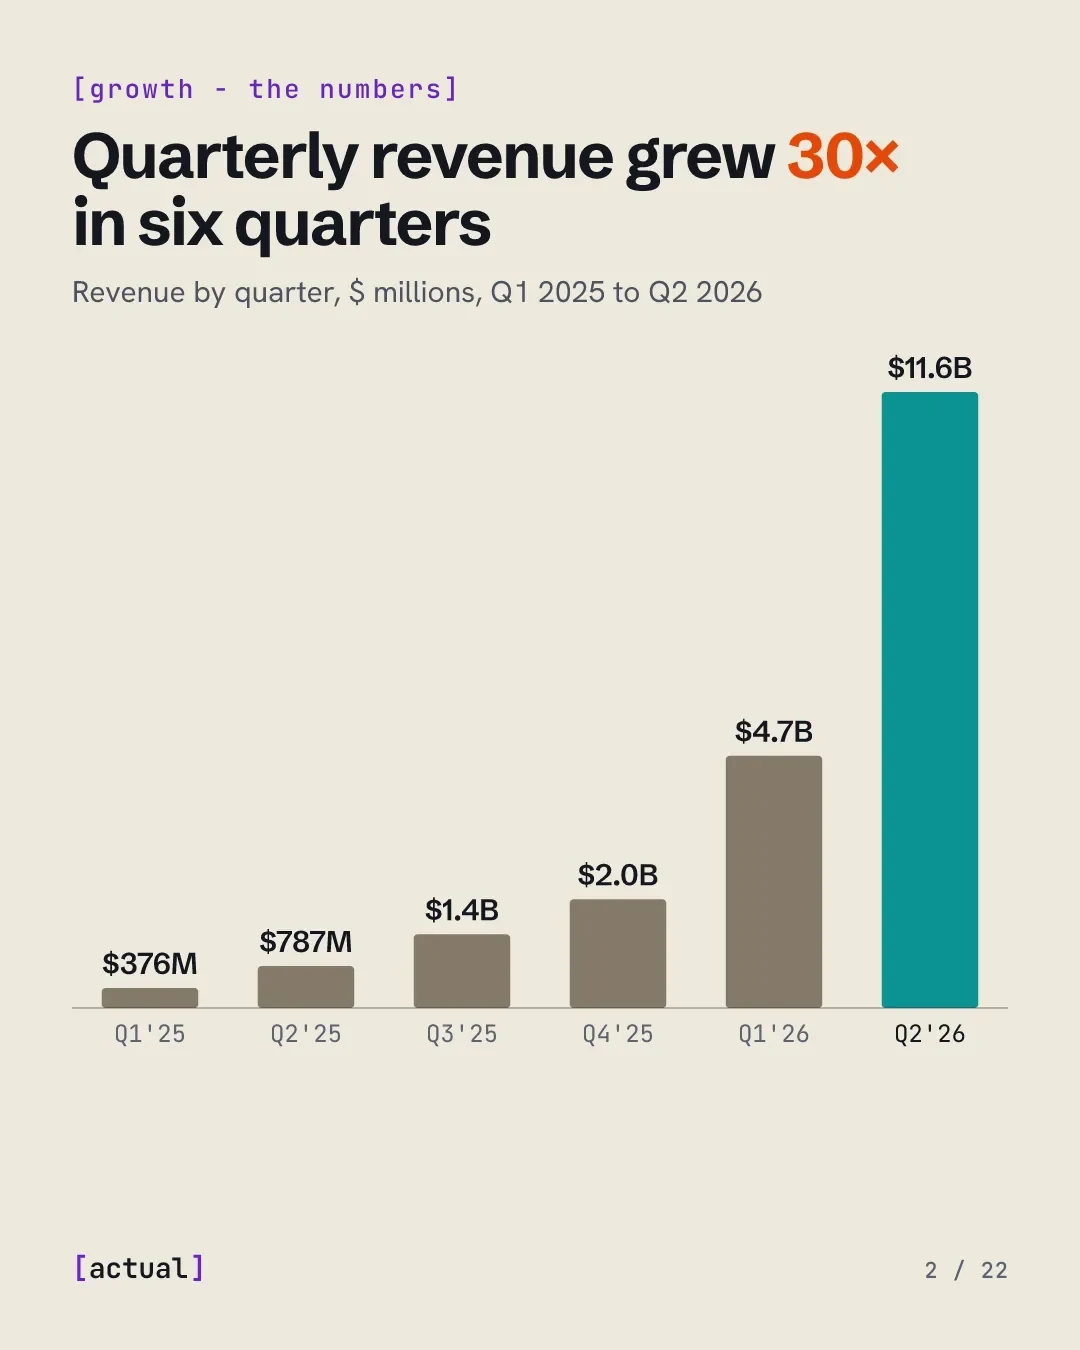
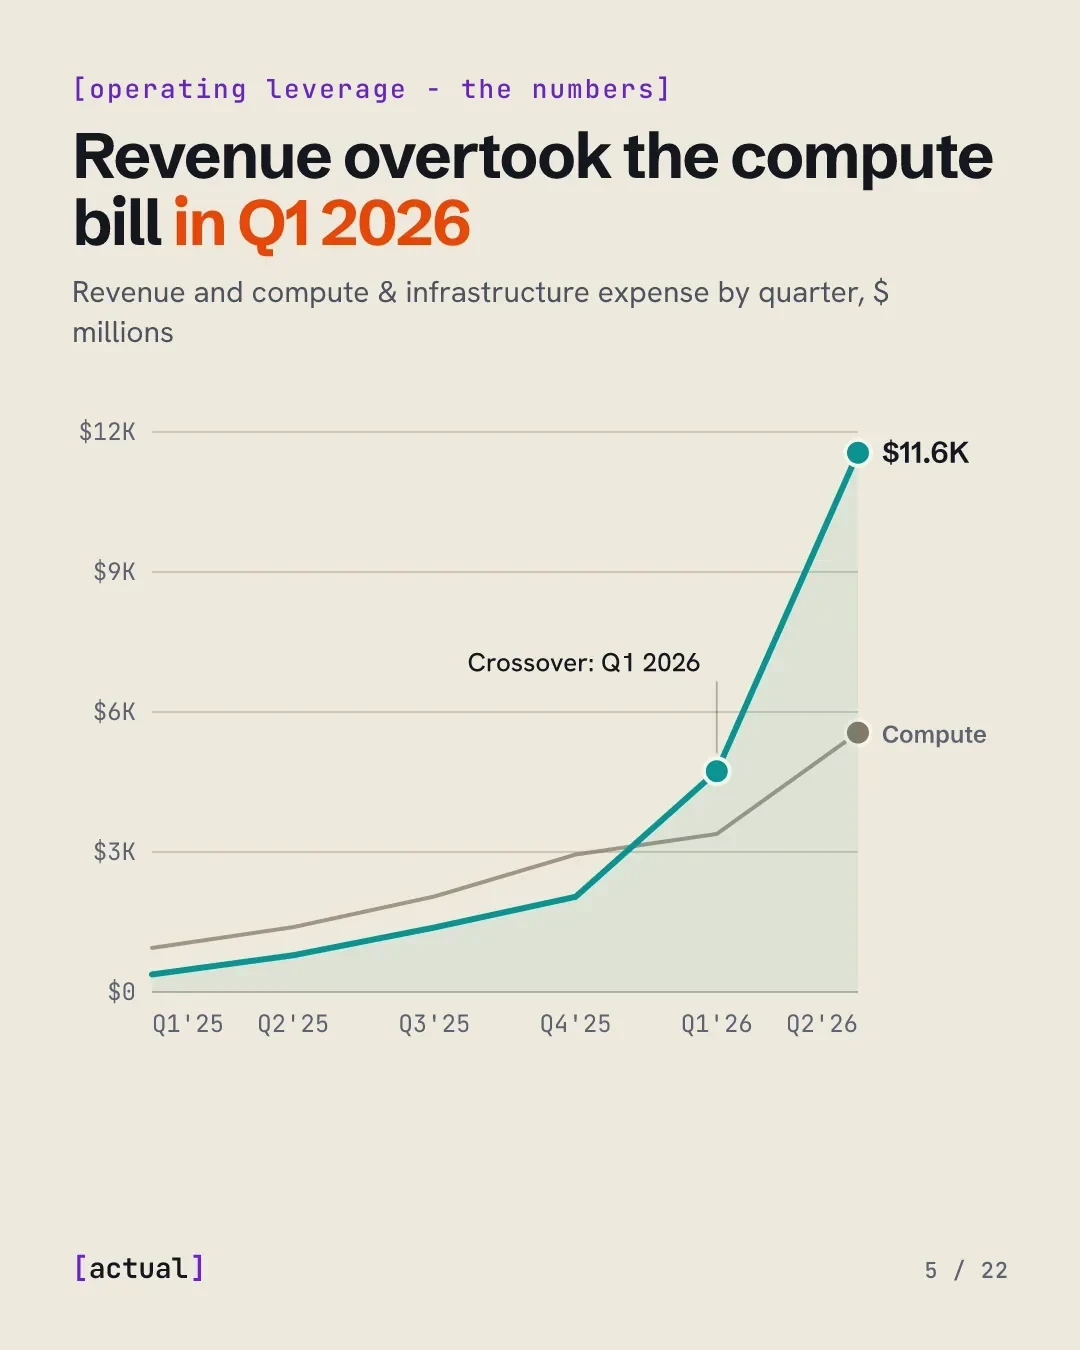
Narrative Claim. “The fastest enterprise adoption of any technology in history.” The revenue line runs from $376M a quarter to $11.6B, up every quarter and 1,368% year over year in Q2 2026.
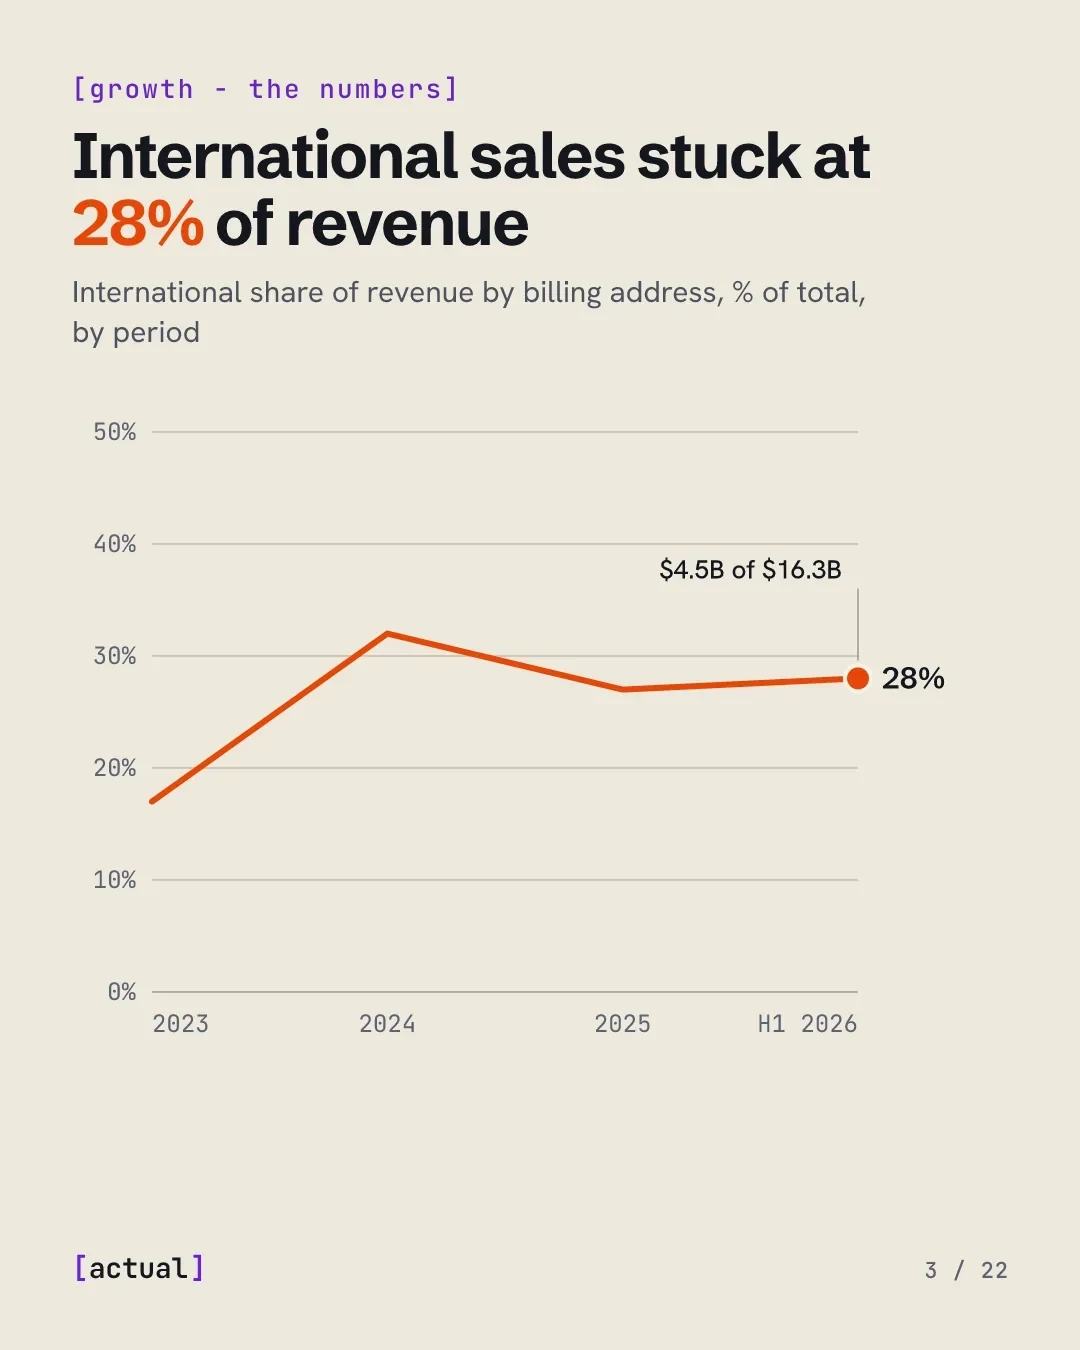
Narrative Claim. International expansion is “a meaningful driver of revenue growth.” The international share of revenue has not moved since 2024, so the growth so far is American.
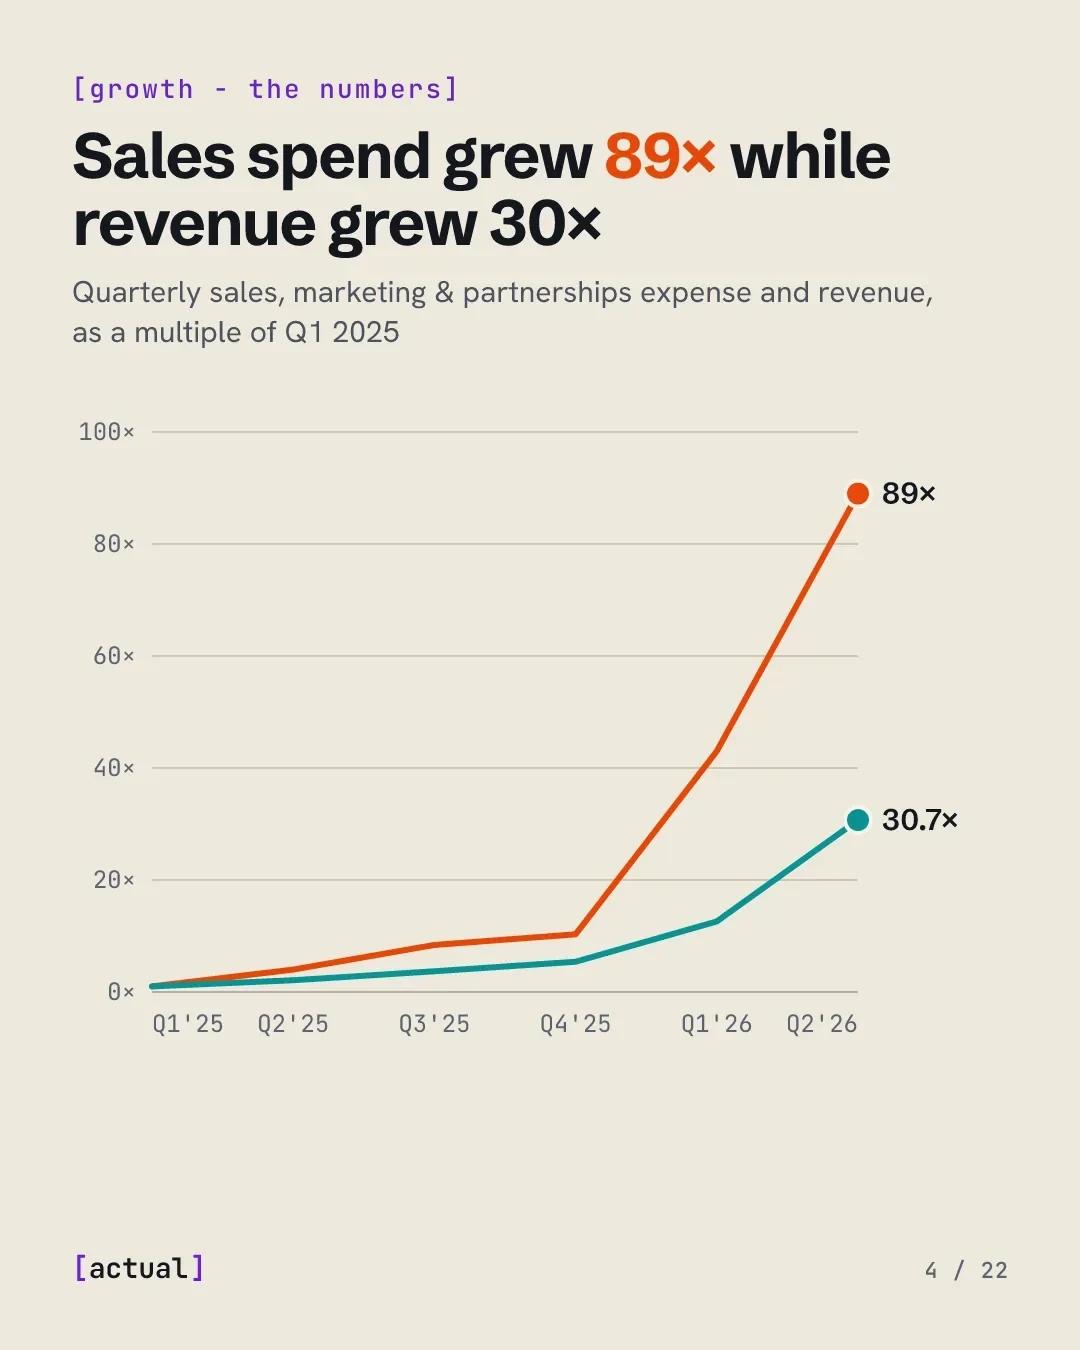
Narrative Claim. The S-1 calls the go-to-market “structurally efficient.” Sales spend was 6% of revenue in Q1 2025 and 18% in Q2 2026. Still lean for enterprise software; no longer free.
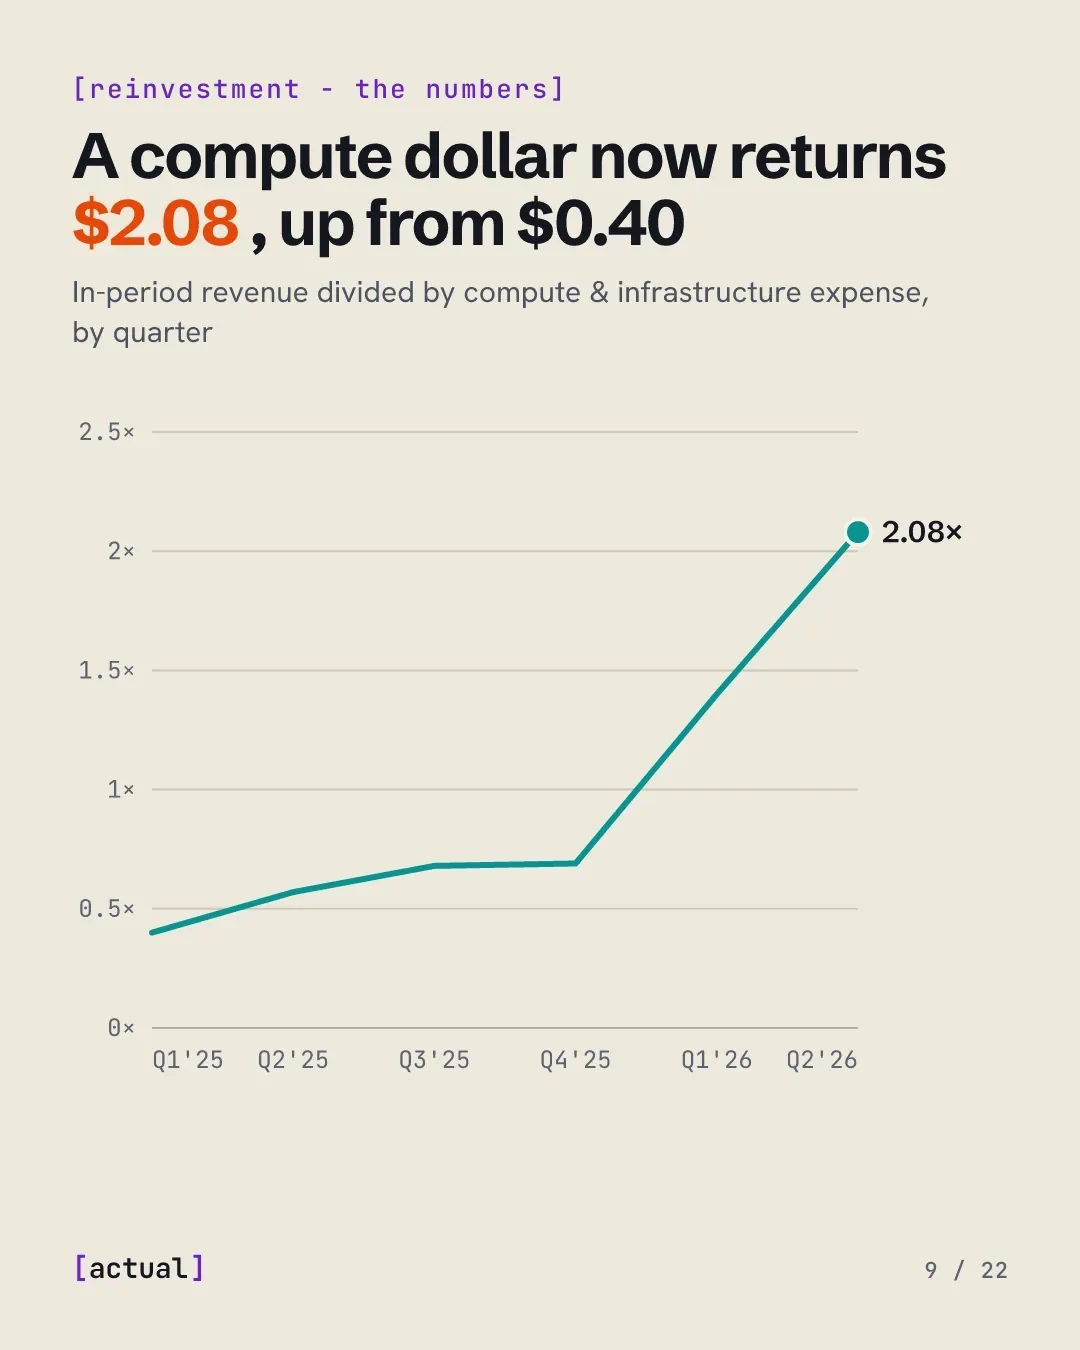
Narrative Claim. Compute is bought 12 to 18 months ahead and expensed as it lands, so the cost base is fixed before the revenue exists. Compute fell from 251% of revenue to 48%.
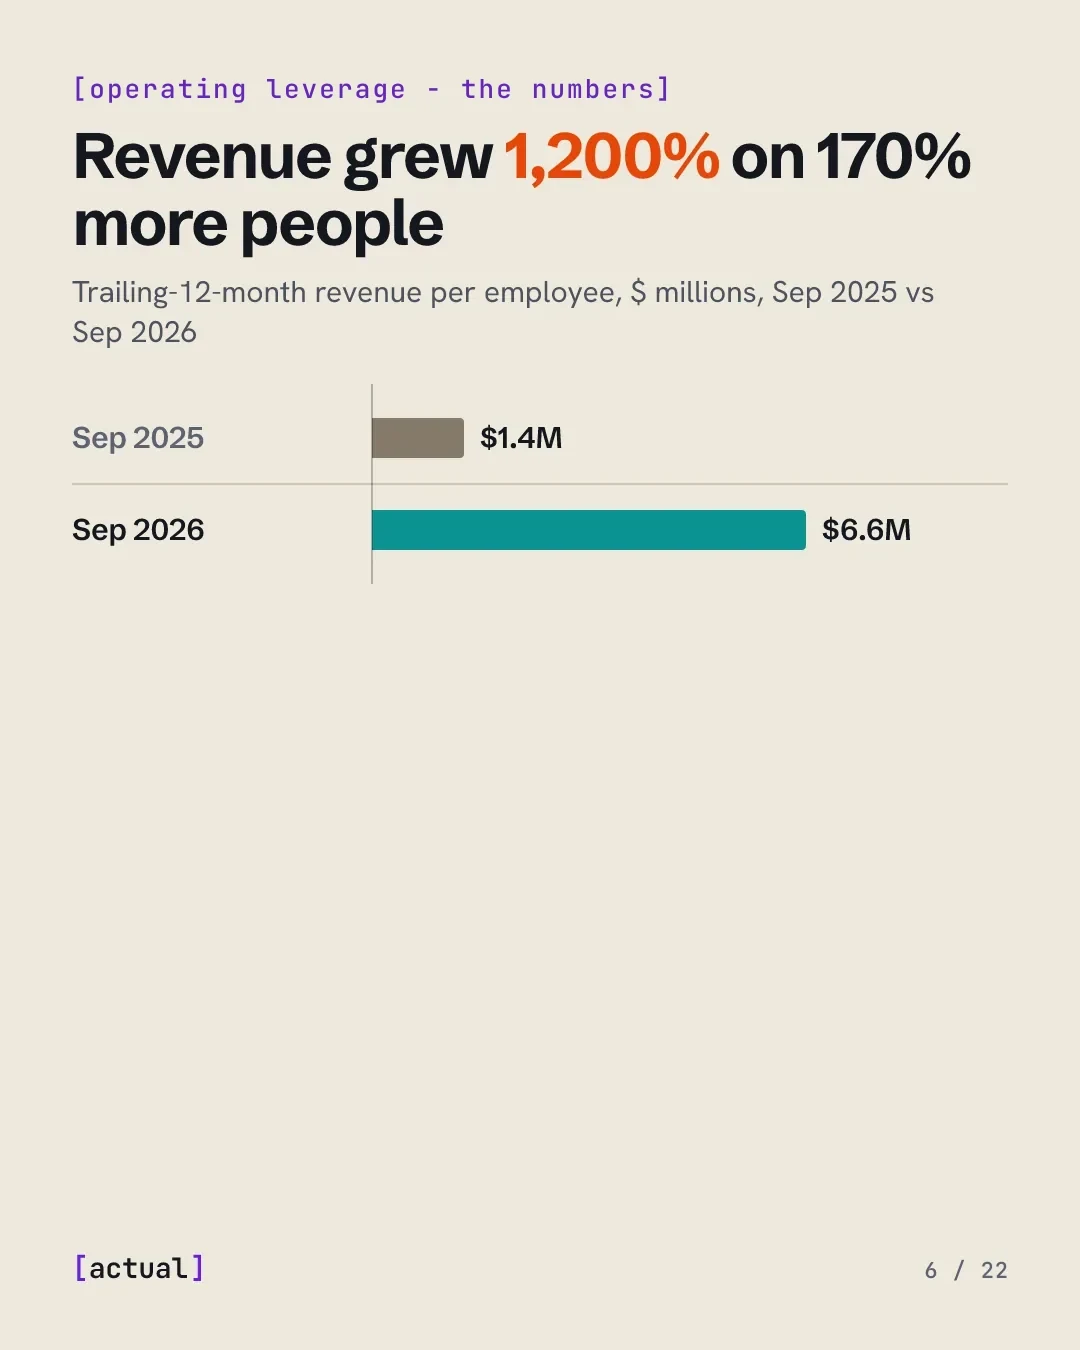
Narrative Claim. Headcount went from about 940 in December 2024 to about 5,300 in September 2026. Over 90% of code contributions in September 2026 were written by Claude. The “talent density” claim has a number behind it.
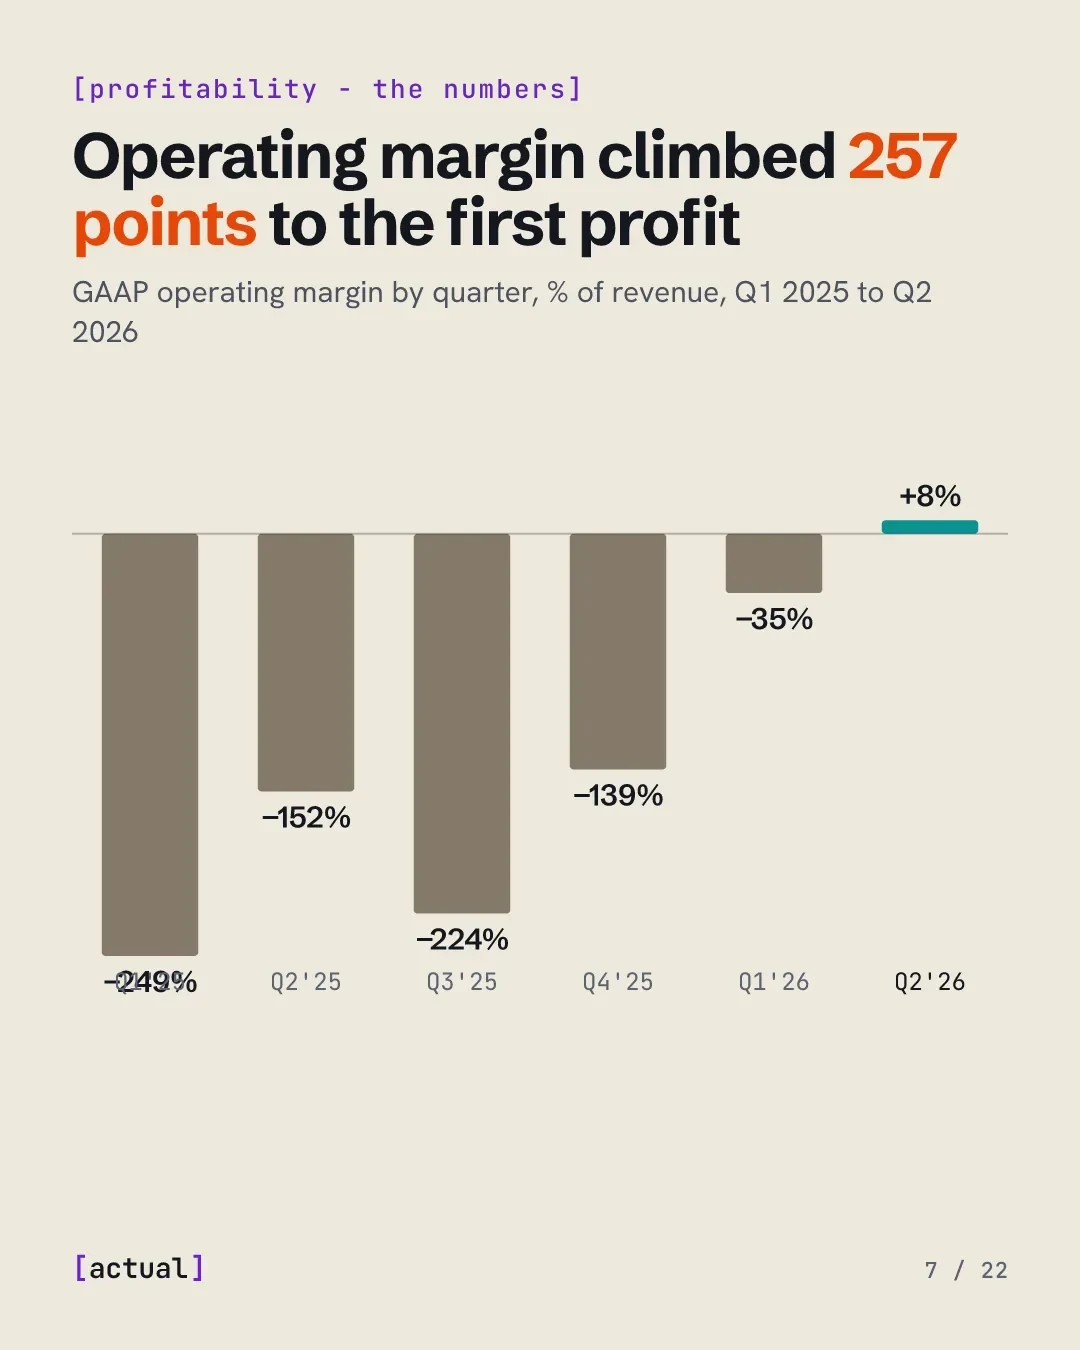
Narrative Claim. Q2 2026 operating income was $974M on $11.6B of revenue. Management says margins will compress again whenever a large block of committed compute comes online.
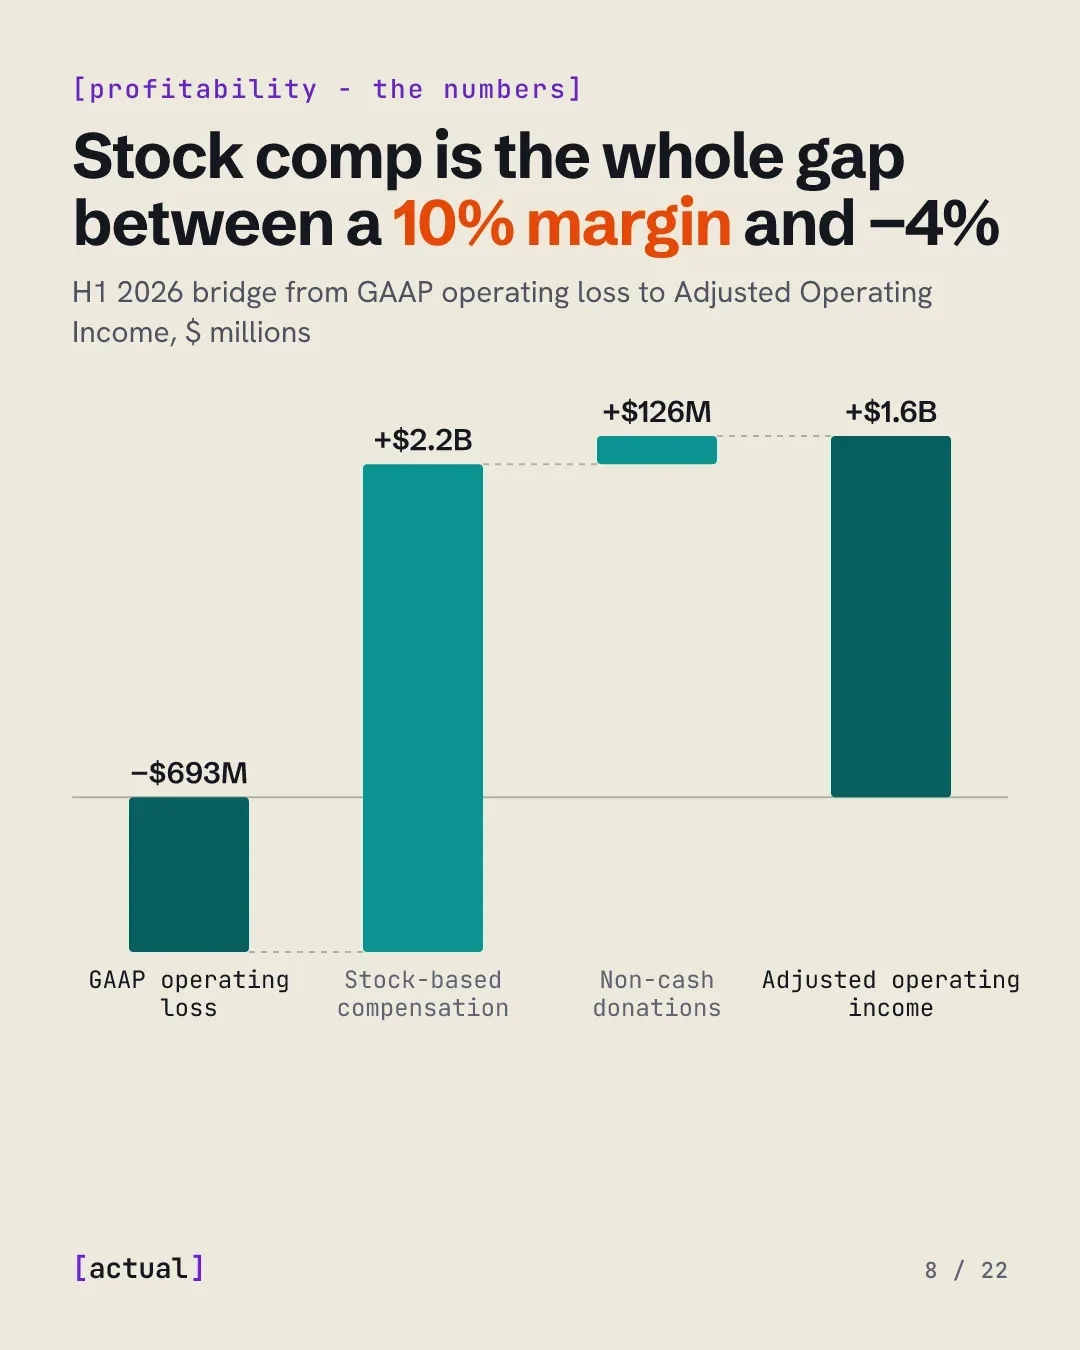
Narrative Claim. The S-1 leads with Adjusted Operating Income. The adjustment is $2.2B of stock-based compensation, 13% of revenue, a cost that will keep rising after the IPO as RSUs vest.
Narrative Claim. Compute efficiency is the S-1’s central economic claim. Revenue grew 1,368% in Q2 2026 while compute expense grew 300%.
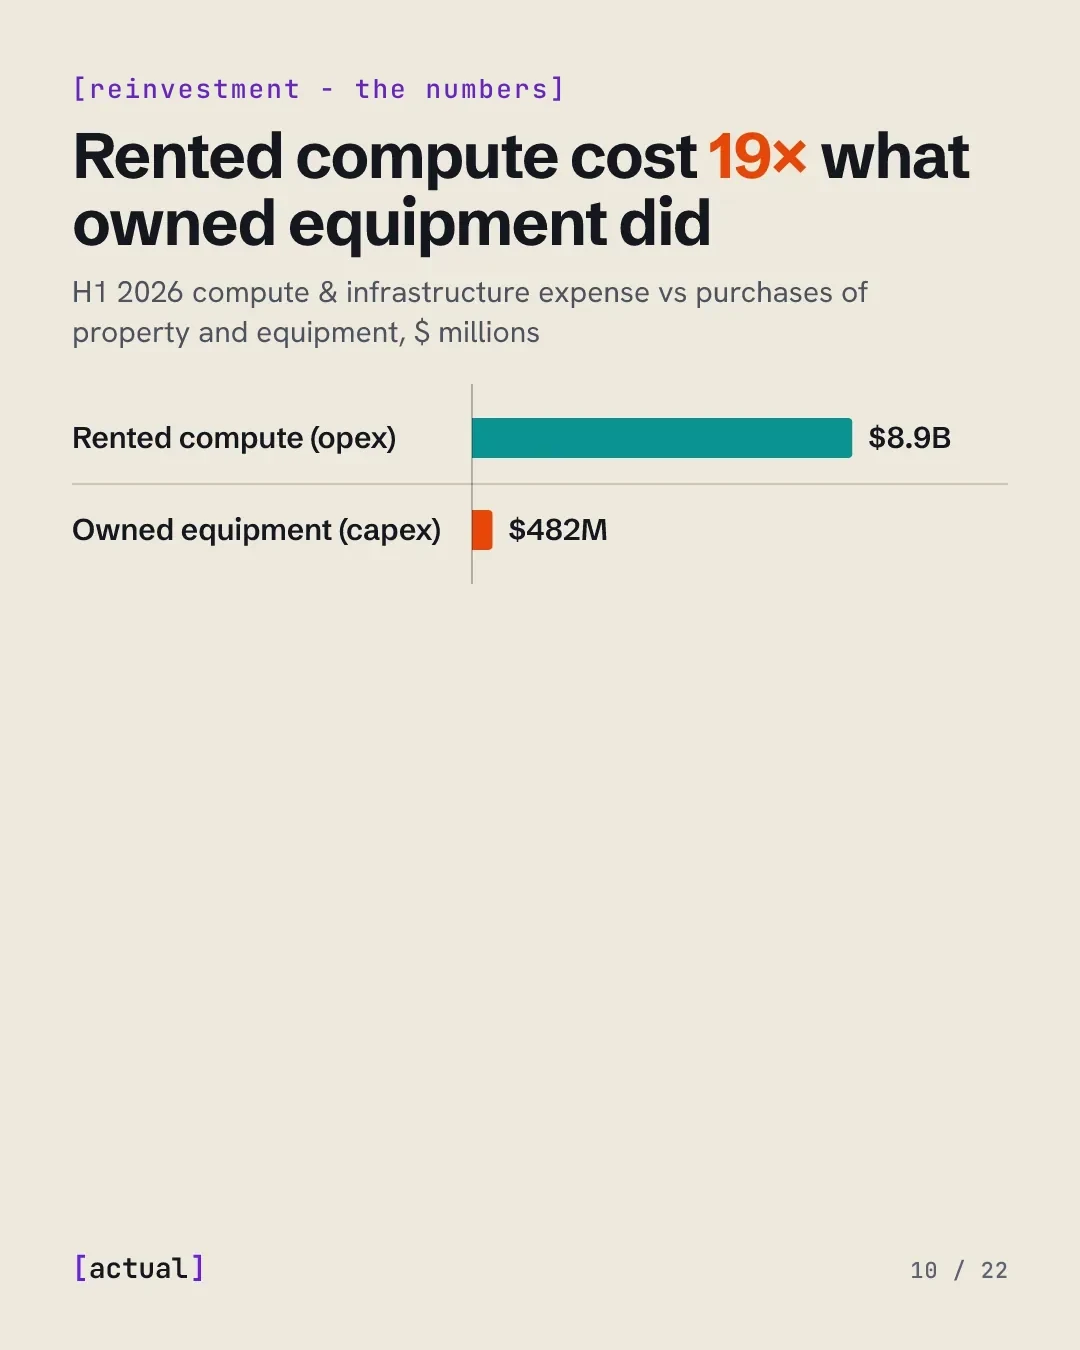
Narrative Claim. The capital intensity lives in opex, through cloud commitments. The S-1 says “Anthropic Direct,” leasing chips into dedicated facilities, will “change the cash flow profile.” Watch capex next year.
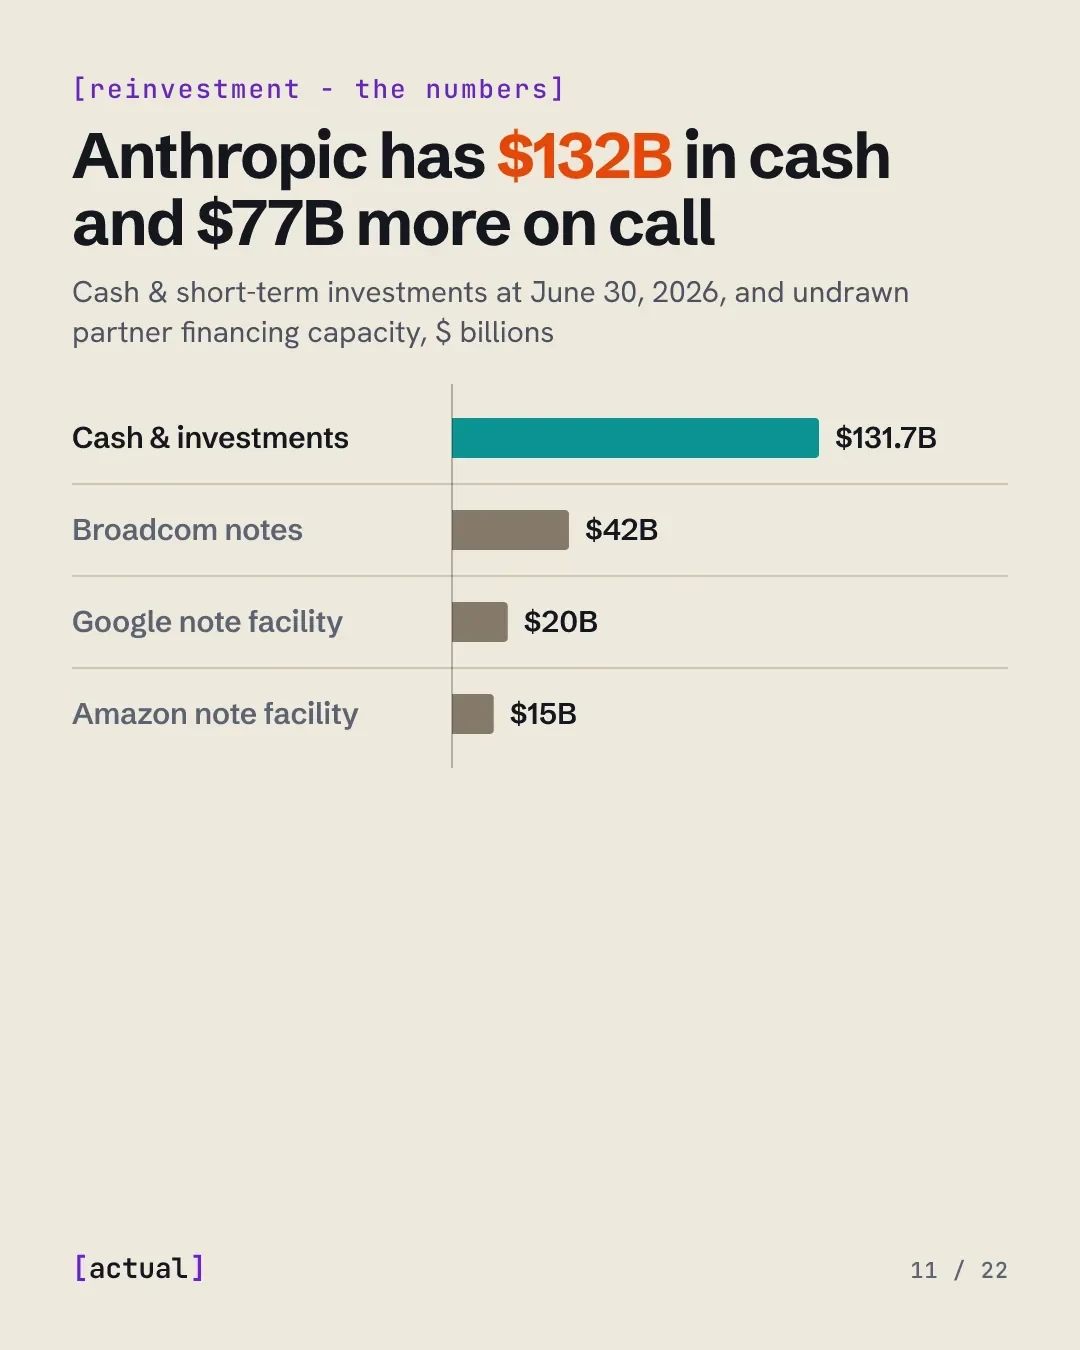
Narrative Claim. Anthropic raised $110B of equity in H1 2026 alone. The IPO proceeds are a blank in the filing; the compute commitments are the number to fill in.
Narrative Claim. “Pay-for-intelligence” means revenue rises and falls with tokens used. It is the same lever that makes compute efficiency the whole margin story.
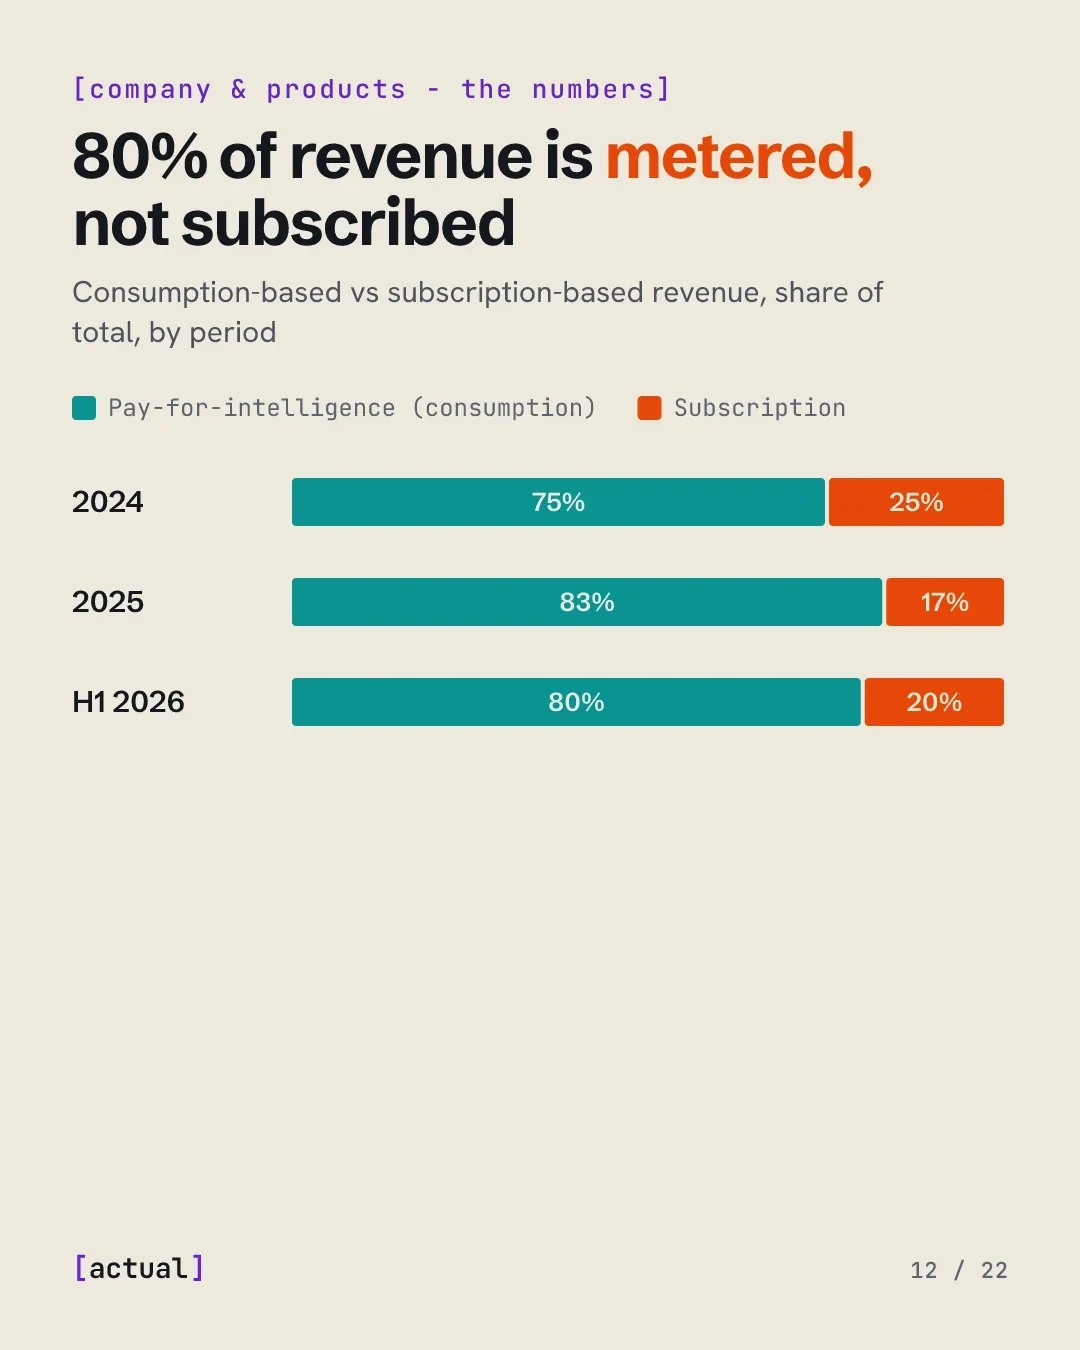
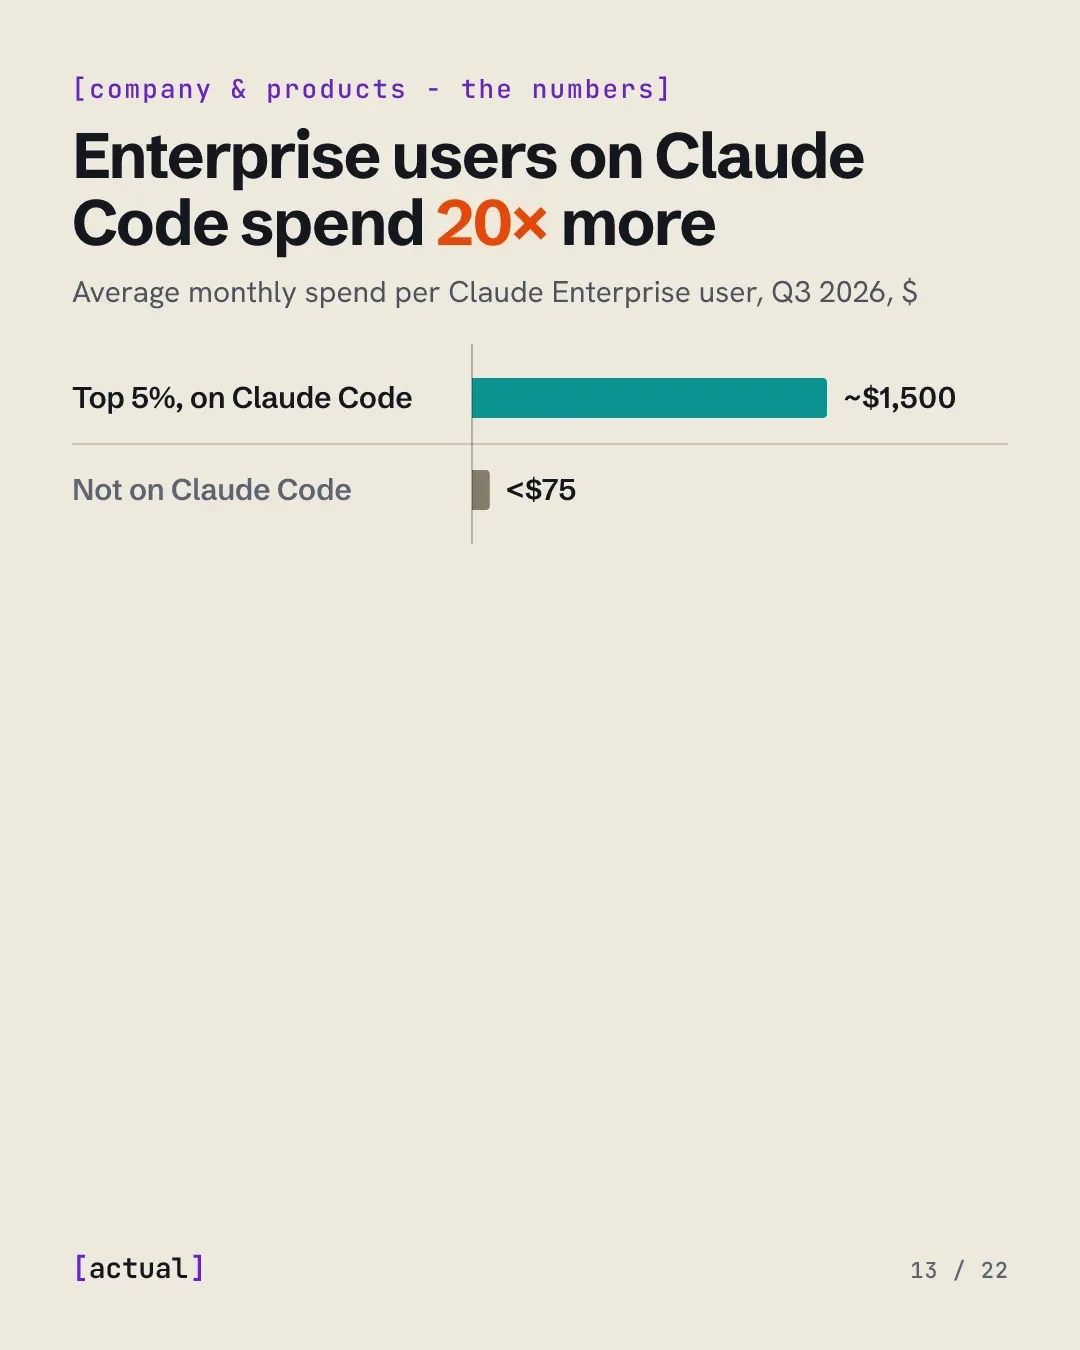
Narrative Claim. Agents consume more compute per task than chat, and the bill follows. The product that proves the agentic thesis is the one that moves the revenue line.
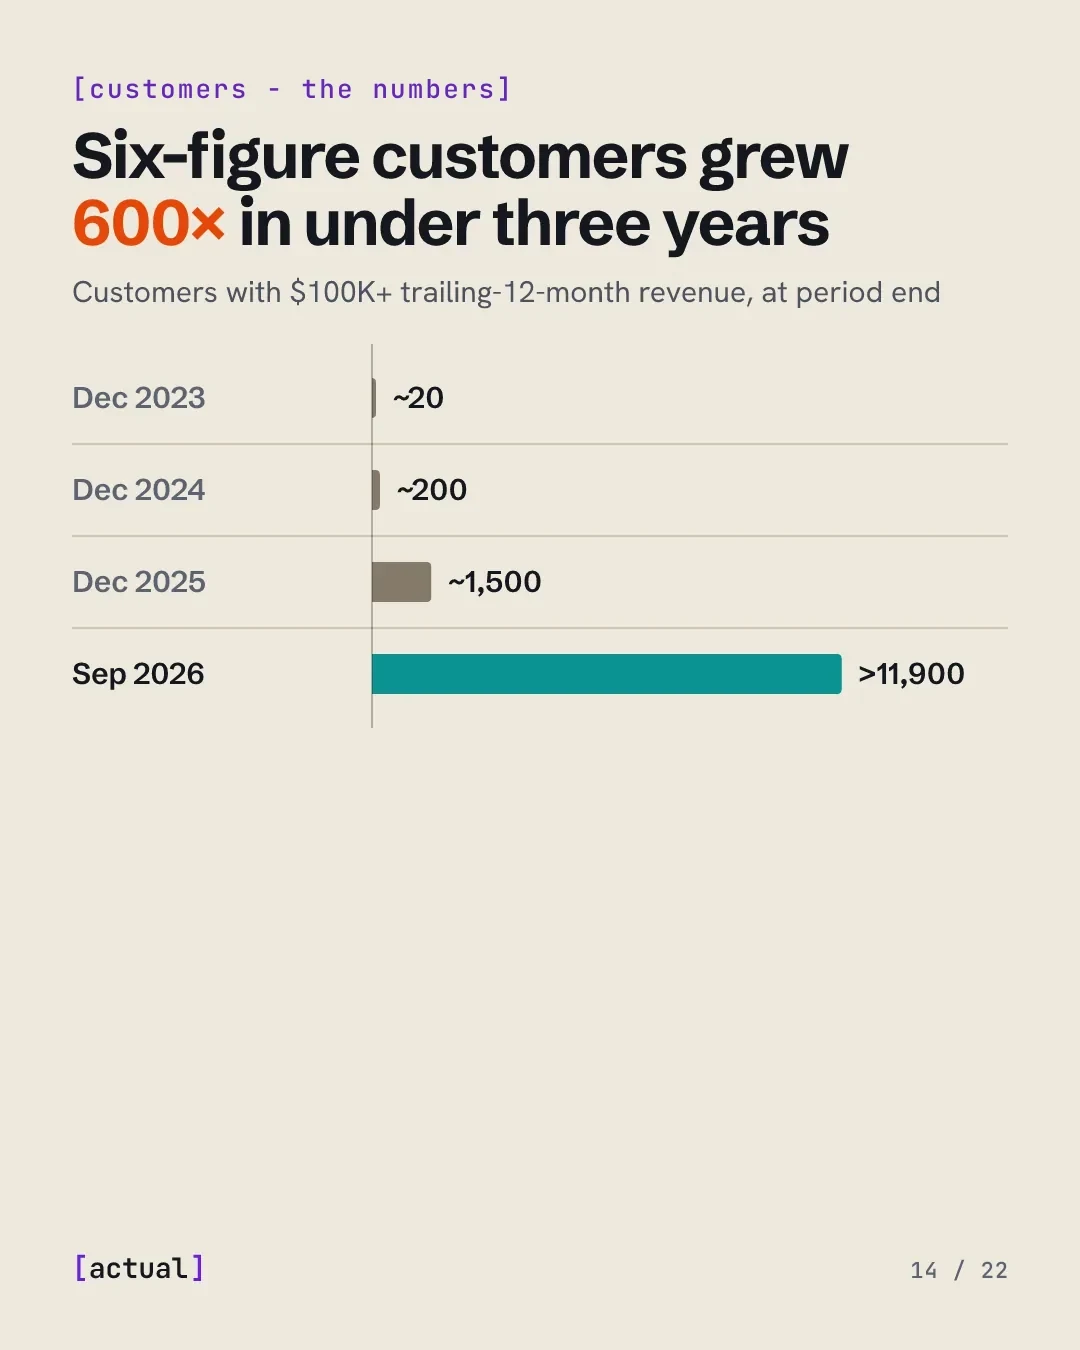
Narrative Claim. Depth follows breadth: 1,900 customers now exceed $1M a year and about 250 exceed $10M. Over half of them use both the platform and a first-party app.
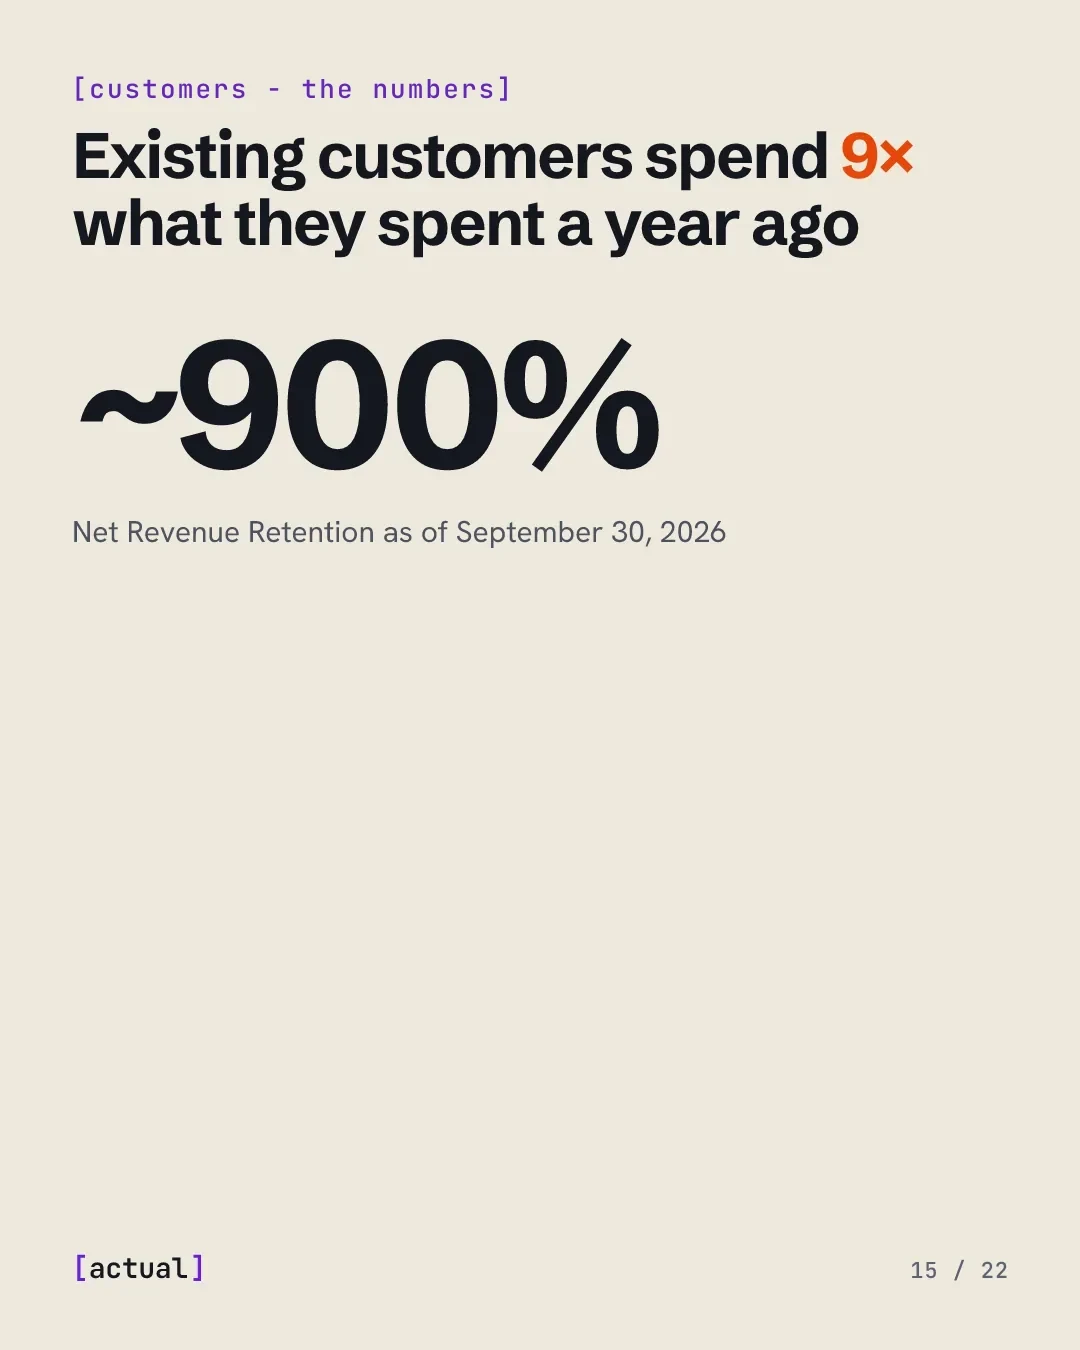
Narrative Claim. Net Revenue Retention was about 900% as of September 30, 2026. It is a company-defined metric that excludes Claude Pro and Max subscribers and has not been independently verified. Even discounted hard, it says expansion, not acquisition, is the growth engine.
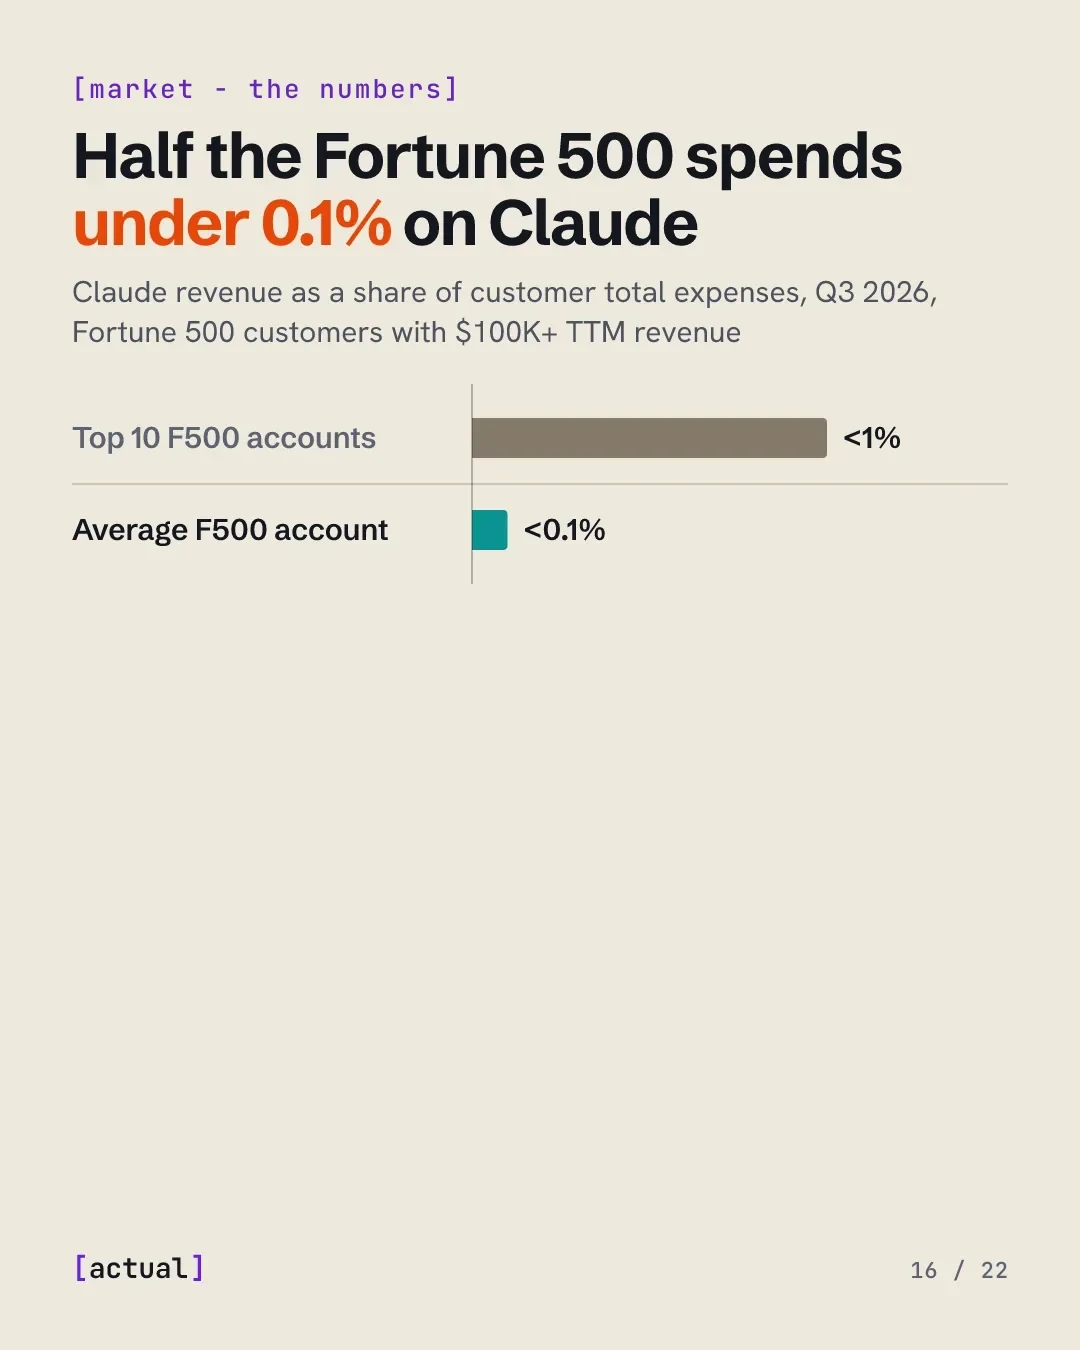
Narrative Claim. The TAM argument in one bar: the largest buyers in the world are customers, and the account is a rounding error. The top ten are eight times further along.
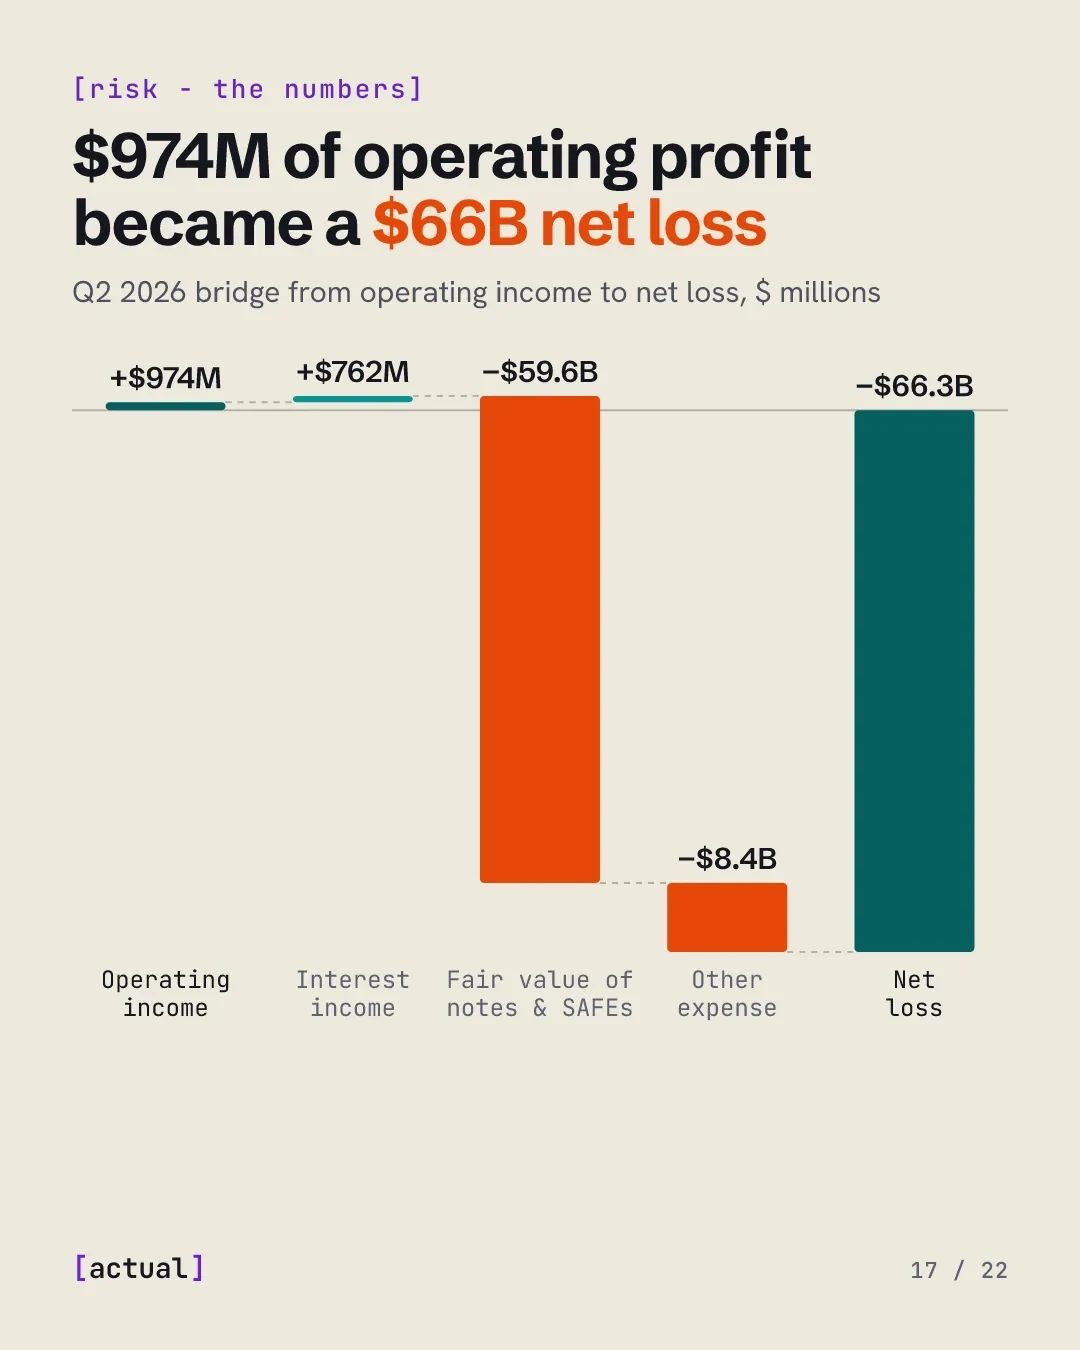
Narrative Claim. The loss is the company marking its own convertible notes and SAFEs to a higher valuation. No cash left the building. The P&L now moves with the price of Anthropic, not the business.
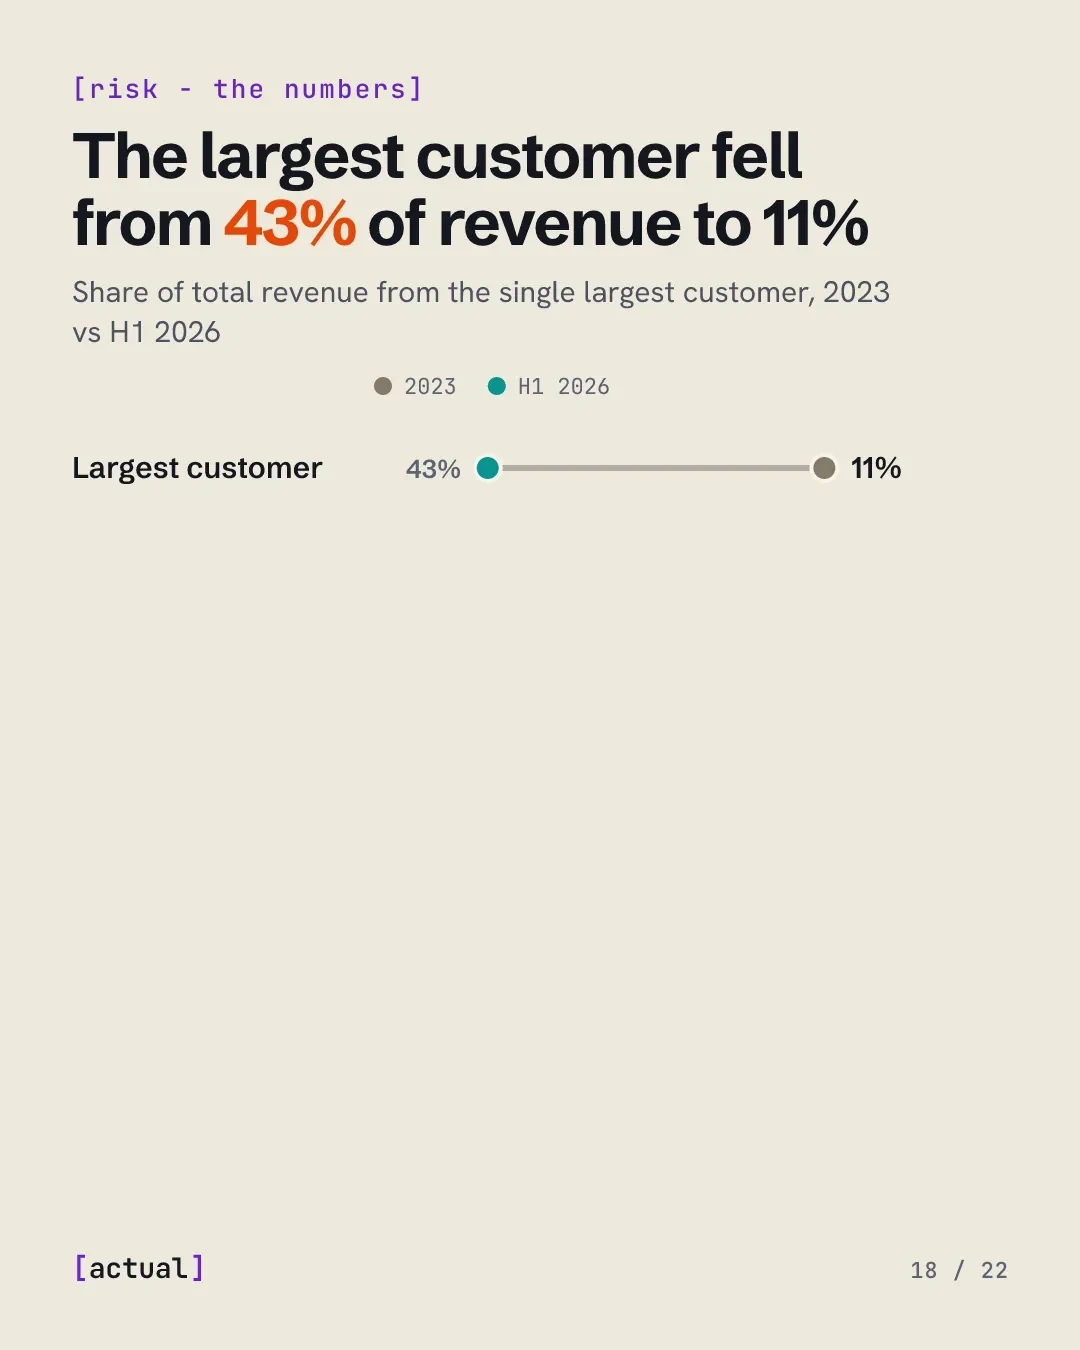
Narrative Claim. In 2023 two customers were 54% of revenue; in H1 2026 one customer crossed 10%. Concentration risk, a standard S-1 warning, has been solved by the numbers before the filing.
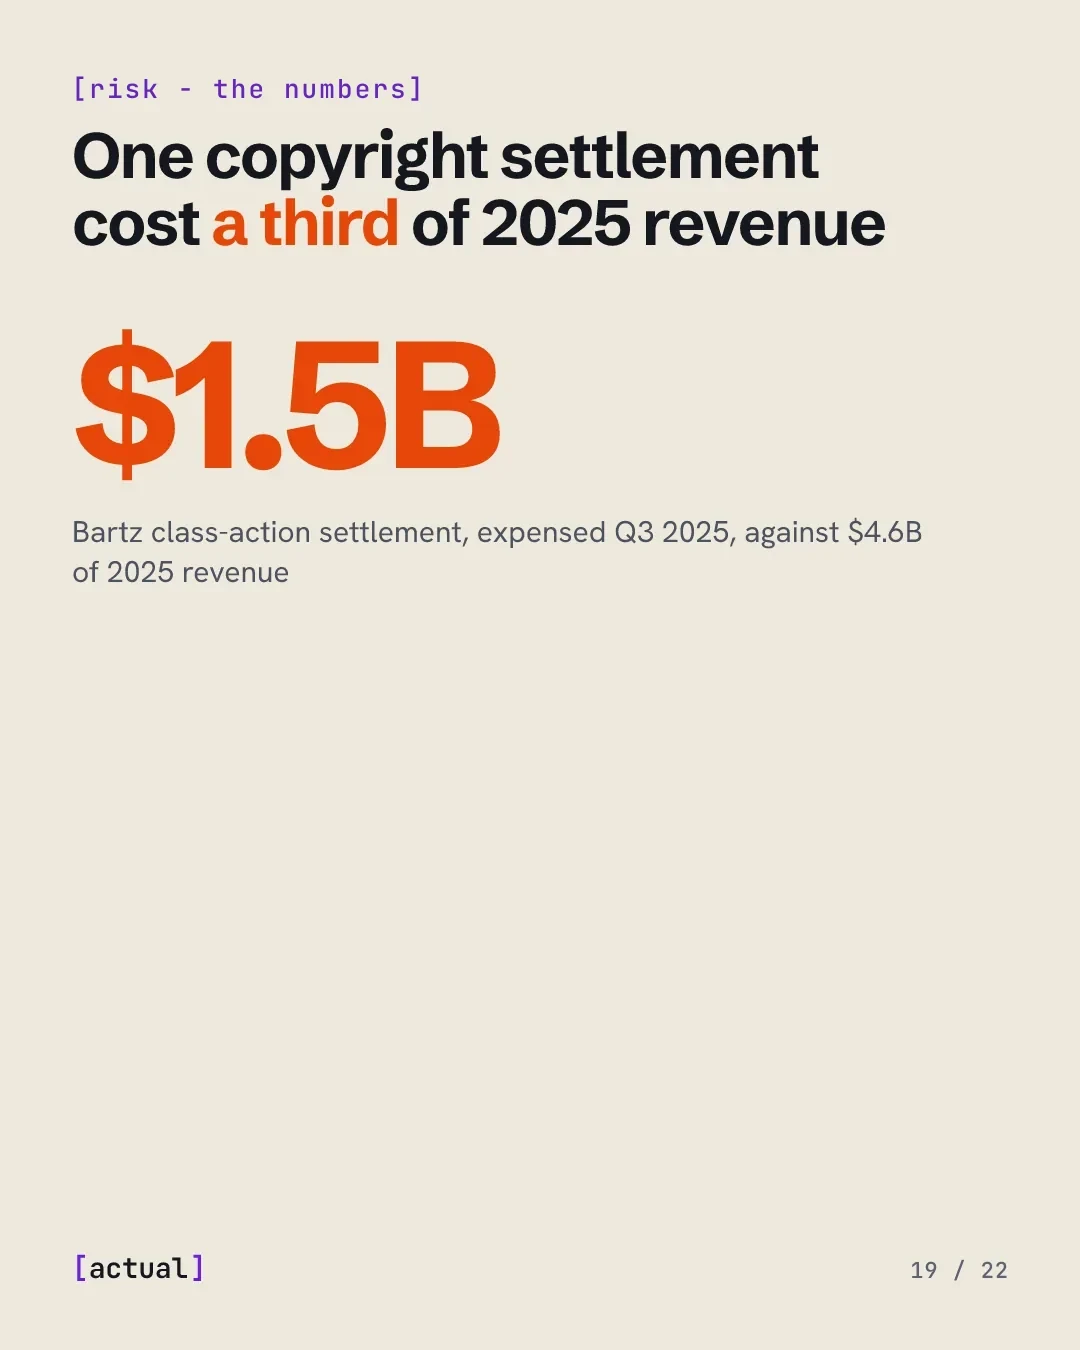
Narrative Claim. The training-data risk factor is not hypothetical; it has a price. The Bartz class-action settlement was expensed in Q3 2025. The filing says other suits are pending and that an adverse fair-use ruling could change the economics of the models.
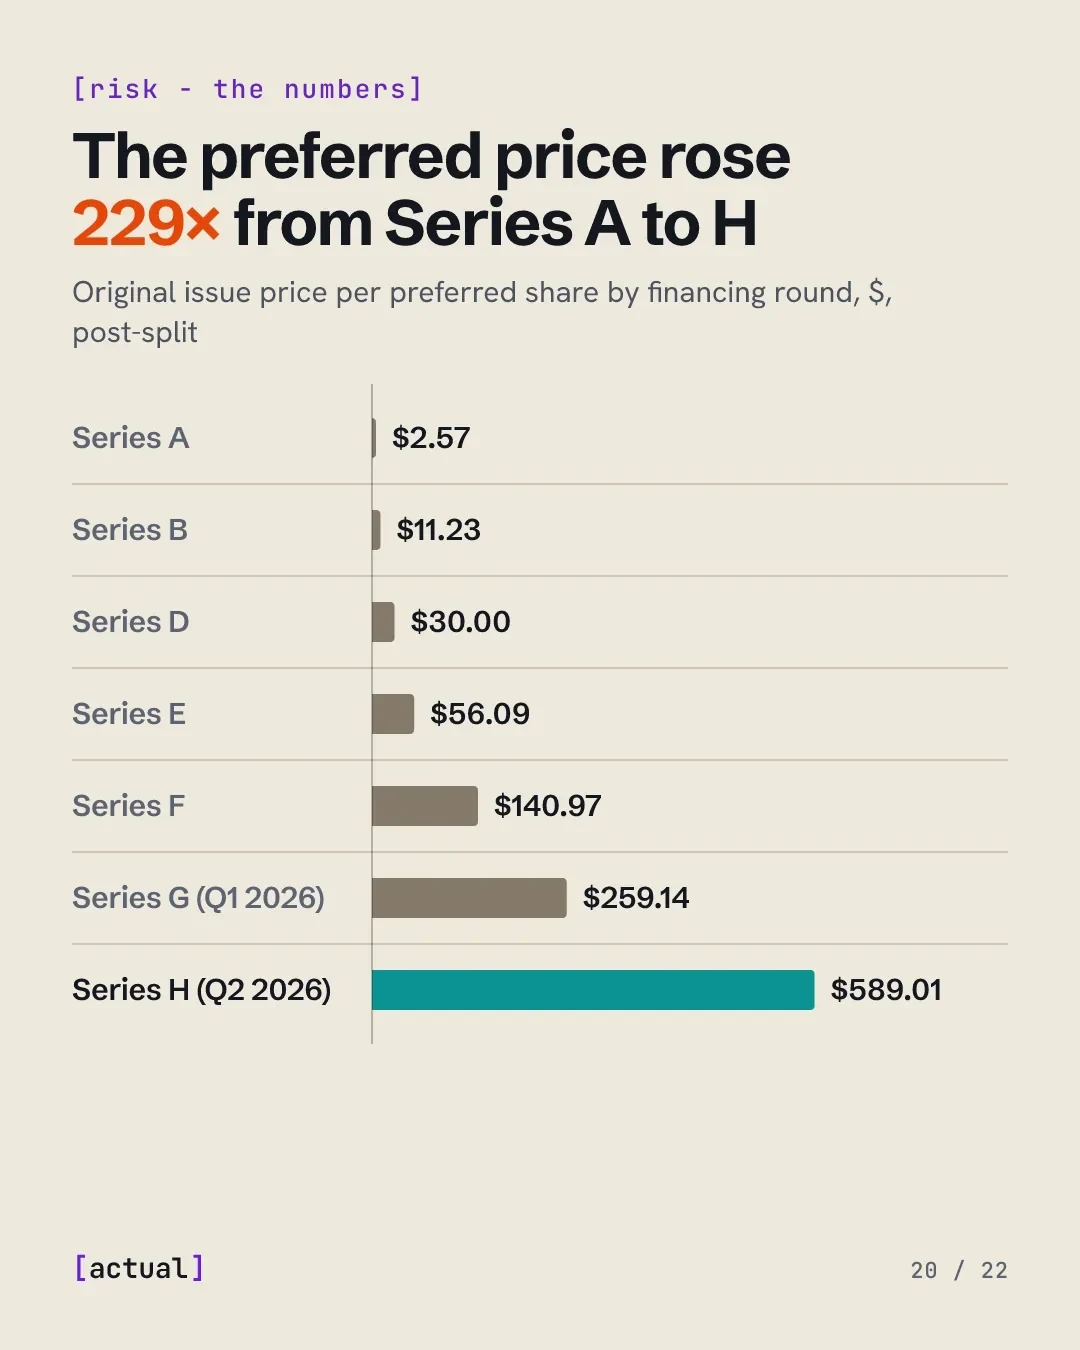
Narrative Claim. Series G to H, three months apart in 2026, was a 2.3× step on its own. The $72B fair-value charge in H1 2026 is the same curve showing up in the income statement.
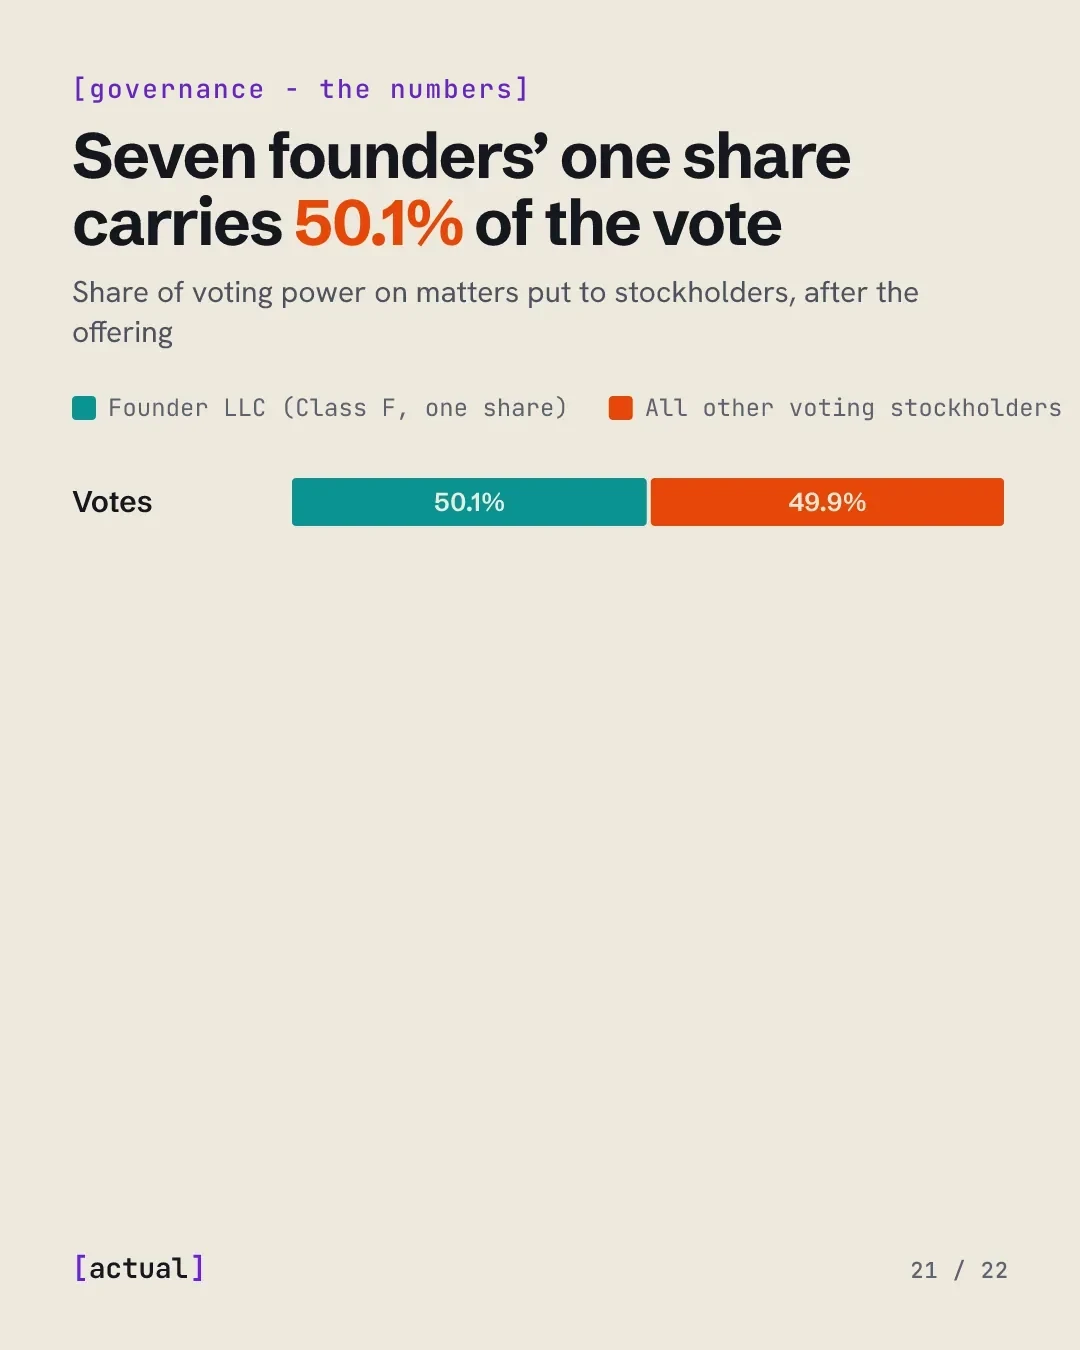
Narrative Claim. Seven founders’ single share carries 50.1% of the vote. Public Class A holders get the other 49.9%. A separate trust, the LTBT, appoints a majority of the board, and Amazon and Google hold non-voting Class N. The governance narrative is the structure.